
VOL. XII · ISSUE 04 · FIELD NOTES
FIELD NOTES · CES 2026
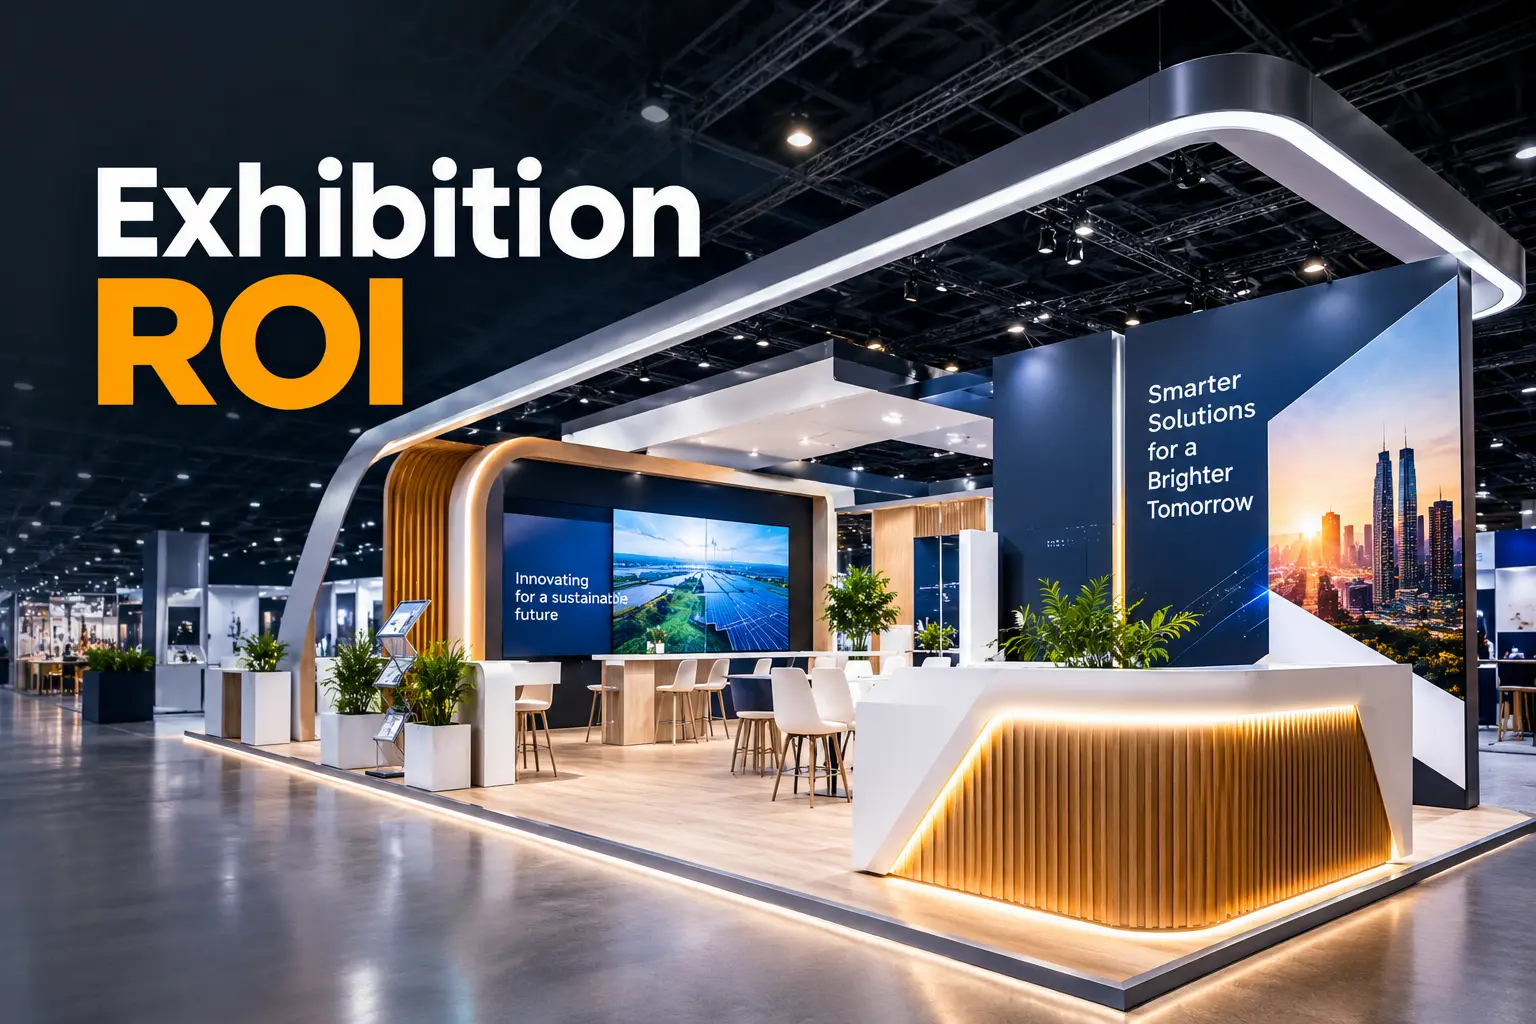
Every budget season, the same question lands on the marketing head’s desk: “What did we actually get from that show?”
“Great footfall” and “lots of conversations” won’t survive a finance review. Cost per lead, cost per meeting and pipeline value will. This guide shows how to calculate each one, which costs to include, which mistakes make exhibition numbers look worse (or better) than they really are, and how to present the result so the budget gets approved.
A paid campaign has a click, a form fill and a CRM record, all timestamped. A trade show has a handshake, a badge scan, a conversation that happened over noise, and a deal that may close nine months later.
That doesn’t make exhibitions unmeasurable. It means you need to decide what you will measure before the show, not after it. Teams that struggle to defend their budget usually have the same problem: they tracked leads but never connected them to meetings, opportunities or revenue.
The three metrics below work as a chain. Cost per lead shows efficiency at the top of the funnel. Cost per meeting shows whether those leads were real. Pipeline value shows whether the meetings were worth having.
Every ROI figure is only as honest as its denominator. The most common error is counting only the space fee and the stand, which makes the show look cheaper than it was and destroys your credibility when finance rebuilds the number.
Include all of the following:
Worked example used throughout this article. A B2B manufacturer exhibits at a major international show. These figures are illustrative, not benchmarks:
Total investment: $120,000. We’ll use this number in every calculation below.
Formula: Total show investment ÷ total leads captured
In our example, 600 badge scans and conversations give a CPL of $200.
That number is a starting point, not a conclusion. A raw lead count includes the curious, the competitors and the people who wanted the free tote bag. Marketing heads who present only raw CPL invite the response, “Sales says those leads were rubbish.”
So split your leads into tiers before the show using criteria sales has agreed to:
If 240 of your 600 leads meet the hot and warm criteria, your cost per qualified lead is $120,000 ÷ 240 = $500. This is the number you should defend, because it shows you understand lead quality and aren’t hiding behind volume.
What good looks like: compare CPL against your own digital channels (paid search, LinkedIn, webinars), not against a generic industry average. Exhibition leads are usually more expensive at the top of the funnel but convert better, because a face-to-face conversation has already done much of the nurturing.
Formula: Total show investment ÷ number of qualified meetings held
A meeting is where exhibition value separates from vanity metrics. Define it tightly: a scheduled or on-stand conversation of meaningful length with a decision-maker or influencer from a target account.
In our example, the team held 90 qualified meetings, so cost per meeting is $120,000 ÷ 90 = $1,333.
Compare this to what your sales team spends to get one meeting through other channels. Outbound SDR programmes, paid events and field sales travel often cost far more per meeting once salaries, tools and travel are counted. At a show, your best prospects have come to you, with the budget holder, the influencer and sometimes the competitor’s customer in the same hall.
Two practical tips make this metric reliable:
This is the number the CFO cares about. Cost per lead and cost per meeting show efficiency, but pipeline value shows return.
Formula: Number of opportunities created × average deal value
In our example, 90 meetings produced 36 sales-accepted opportunities, each with an average deal value of $60,000:
36 × $60,000 = $2,160,000 in pipeline
Two ratios make this meaningful:
Weight your pipeline honestly
Raw pipeline value overstates reality, and experienced finance leaders know it. Apply the stage probabilities your sales team already uses in the CRM. If the average opportunity from the show carries a 25% probability, the weighted pipeline is $2,160,000 × 25% = $540,000, or 4.5 times the investment.
Presenting both the raw and weighted figures shows you aren’t inflating the result, and that goes a long way in a budget meeting.
Pipeline is a leading indicator. Closed revenue is the proof. Because exhibition deals often take six to twelve months, set up tracking so you can come back and report the outcome.
Formula: (Gross profit from show-sourced deals − total investment) ÷ total investment × 100
If the team wins 20% of the 36 opportunities, that’s about 7 deals × $60,000 = $420,000 in revenue. At a 40% gross margin, gross profit is $168,000.
ROI = ($168,000 − $120,000) ÷ $120,000 = 40% on first-year gross profit.
Note what this shows. On revenue alone the show looks like a 250% return, but on gross profit it is 40%. Use the gross-profit version for the formal ROI figure. It is the more conservative and credible one, and it stands up to scrutiny.
Also account for influenced revenue: existing customers and open deals that were accelerated by meeting at the show. Report it separately and label it clearly, so it adds context without muddying the headline number.
The best calculation in the world fails if the data is missing. Before you ship the stand, do the following:
Leaving out hidden costs. Staff time, travel and marketing spend are routinely missing from the calculation.
Counting badge scans as leads. Volume without qualification gives you a low CPL that sales will not believe.
Charging the whole stand to one show. If a stand is built for reuse, spread the cost across the shows it will serve. Modular and rental booth systems are designed for this, and our Store & Reuse service keeps a stand working across your calendar. A modular exhibition stand can lower your per-show cost significantly.
Measuring too early. Judging a show a week after it closes captures only the lead stage. Allow time for the pipeline to mature.
Ignoring the stand’s effect on results. Stand design influences dwell time, meeting capacity and brand impression. A stand that fails to attract the right visitors raises your cost per lead. When you’re vetting partners, our guide to red flags when choosing an exhibition stand builder is worth reading, because a missed install window or a poorly planned layout lowers your ROI before the doors open.
Keep the story simple and sequential. A structure that works well:
Close with a recommendation, not a report. “Based on a weighted pipeline of 4.5 times investment, we recommend renewing this show and increasing meeting capacity” is a sentence a finance director can act on.
Once you’re measuring, you can improve. The levers that usually move the numbers most:
What is a good ROI for an exhibition?
There’s no universal figure. It depends on your sales cycle, deal size and margin. Set your own benchmark from past shows, and aim for improvement each time.
How long should I wait before judging a show’s ROI?
Report leads and meetings within 30 days, then pipeline at 90 days and closed revenue at 180 days or longer, depending on your sales cycle.
Should I include the stand cost in ROI?
Yes, but allocate it sensibly. For a stand reused across several shows, charge each show its share, not the full amount.
What if my show doesn’t produce direct sales?
Track meetings, pipeline and influenced revenue. For brand-led exhibitions, also measure account reach, customer meetings held and partner introductions, and be explicit that these are strategic outcomes.
How do I calculate exhibition ROI with a small budget?
The method is the same. A modest 10×10 booth with disciplined tracking can give a better ROI than a large stand with no measurement.
Strong exhibition results come from planning the measurement as carefully as the stand. If you’re preparing your next show, talk to the BuilderDeck team. We design and build stands around your goals, from first sketch to final dismantle, and you can see what that looks like in our portfolio. Browse more guides on the BuilderDeck blog.
Three or four new essays per quarter on design, sustainability, logistics and the trade-show floor. No promos, no calendar spam.
ONE EMAIL PER QUARTER · UNSUBSCRIBE ANY TIME
